Breaking the chokepoint: from finding to decision
Key findings
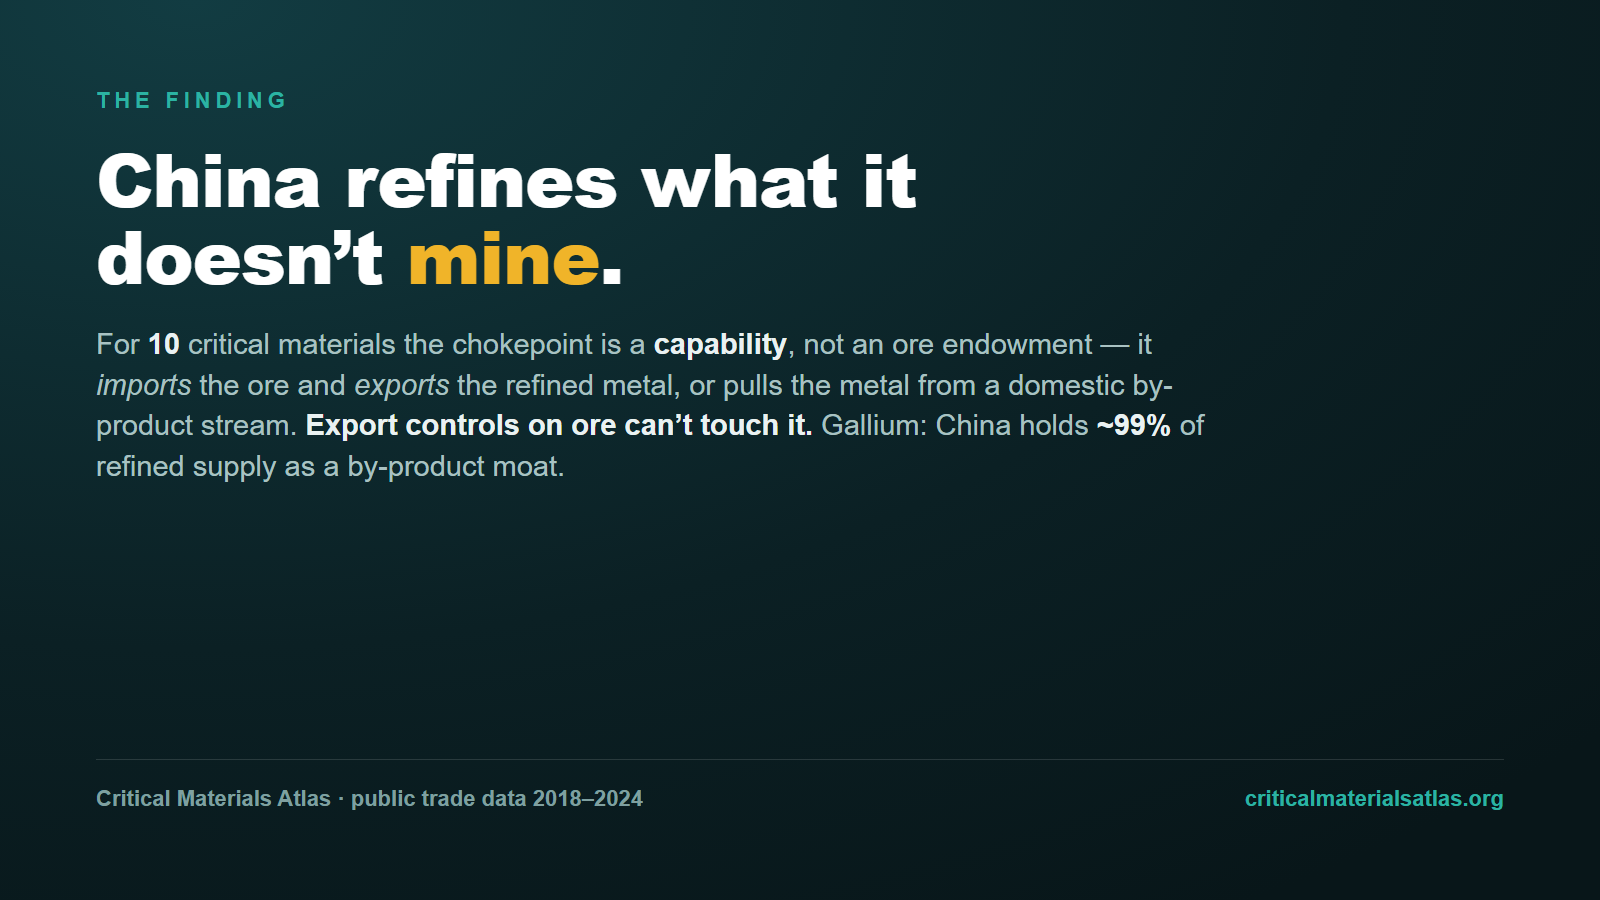
- Capability, not endowment. For 10 of 32 materials the chokepoint is a processing capability — the leader imports the ore and exports the refined metal, or extracts the metal as a by-product of a domestic host. No embargo on ore reaches it. Gallium is the clean case: China refines ~99% and mines almost none.
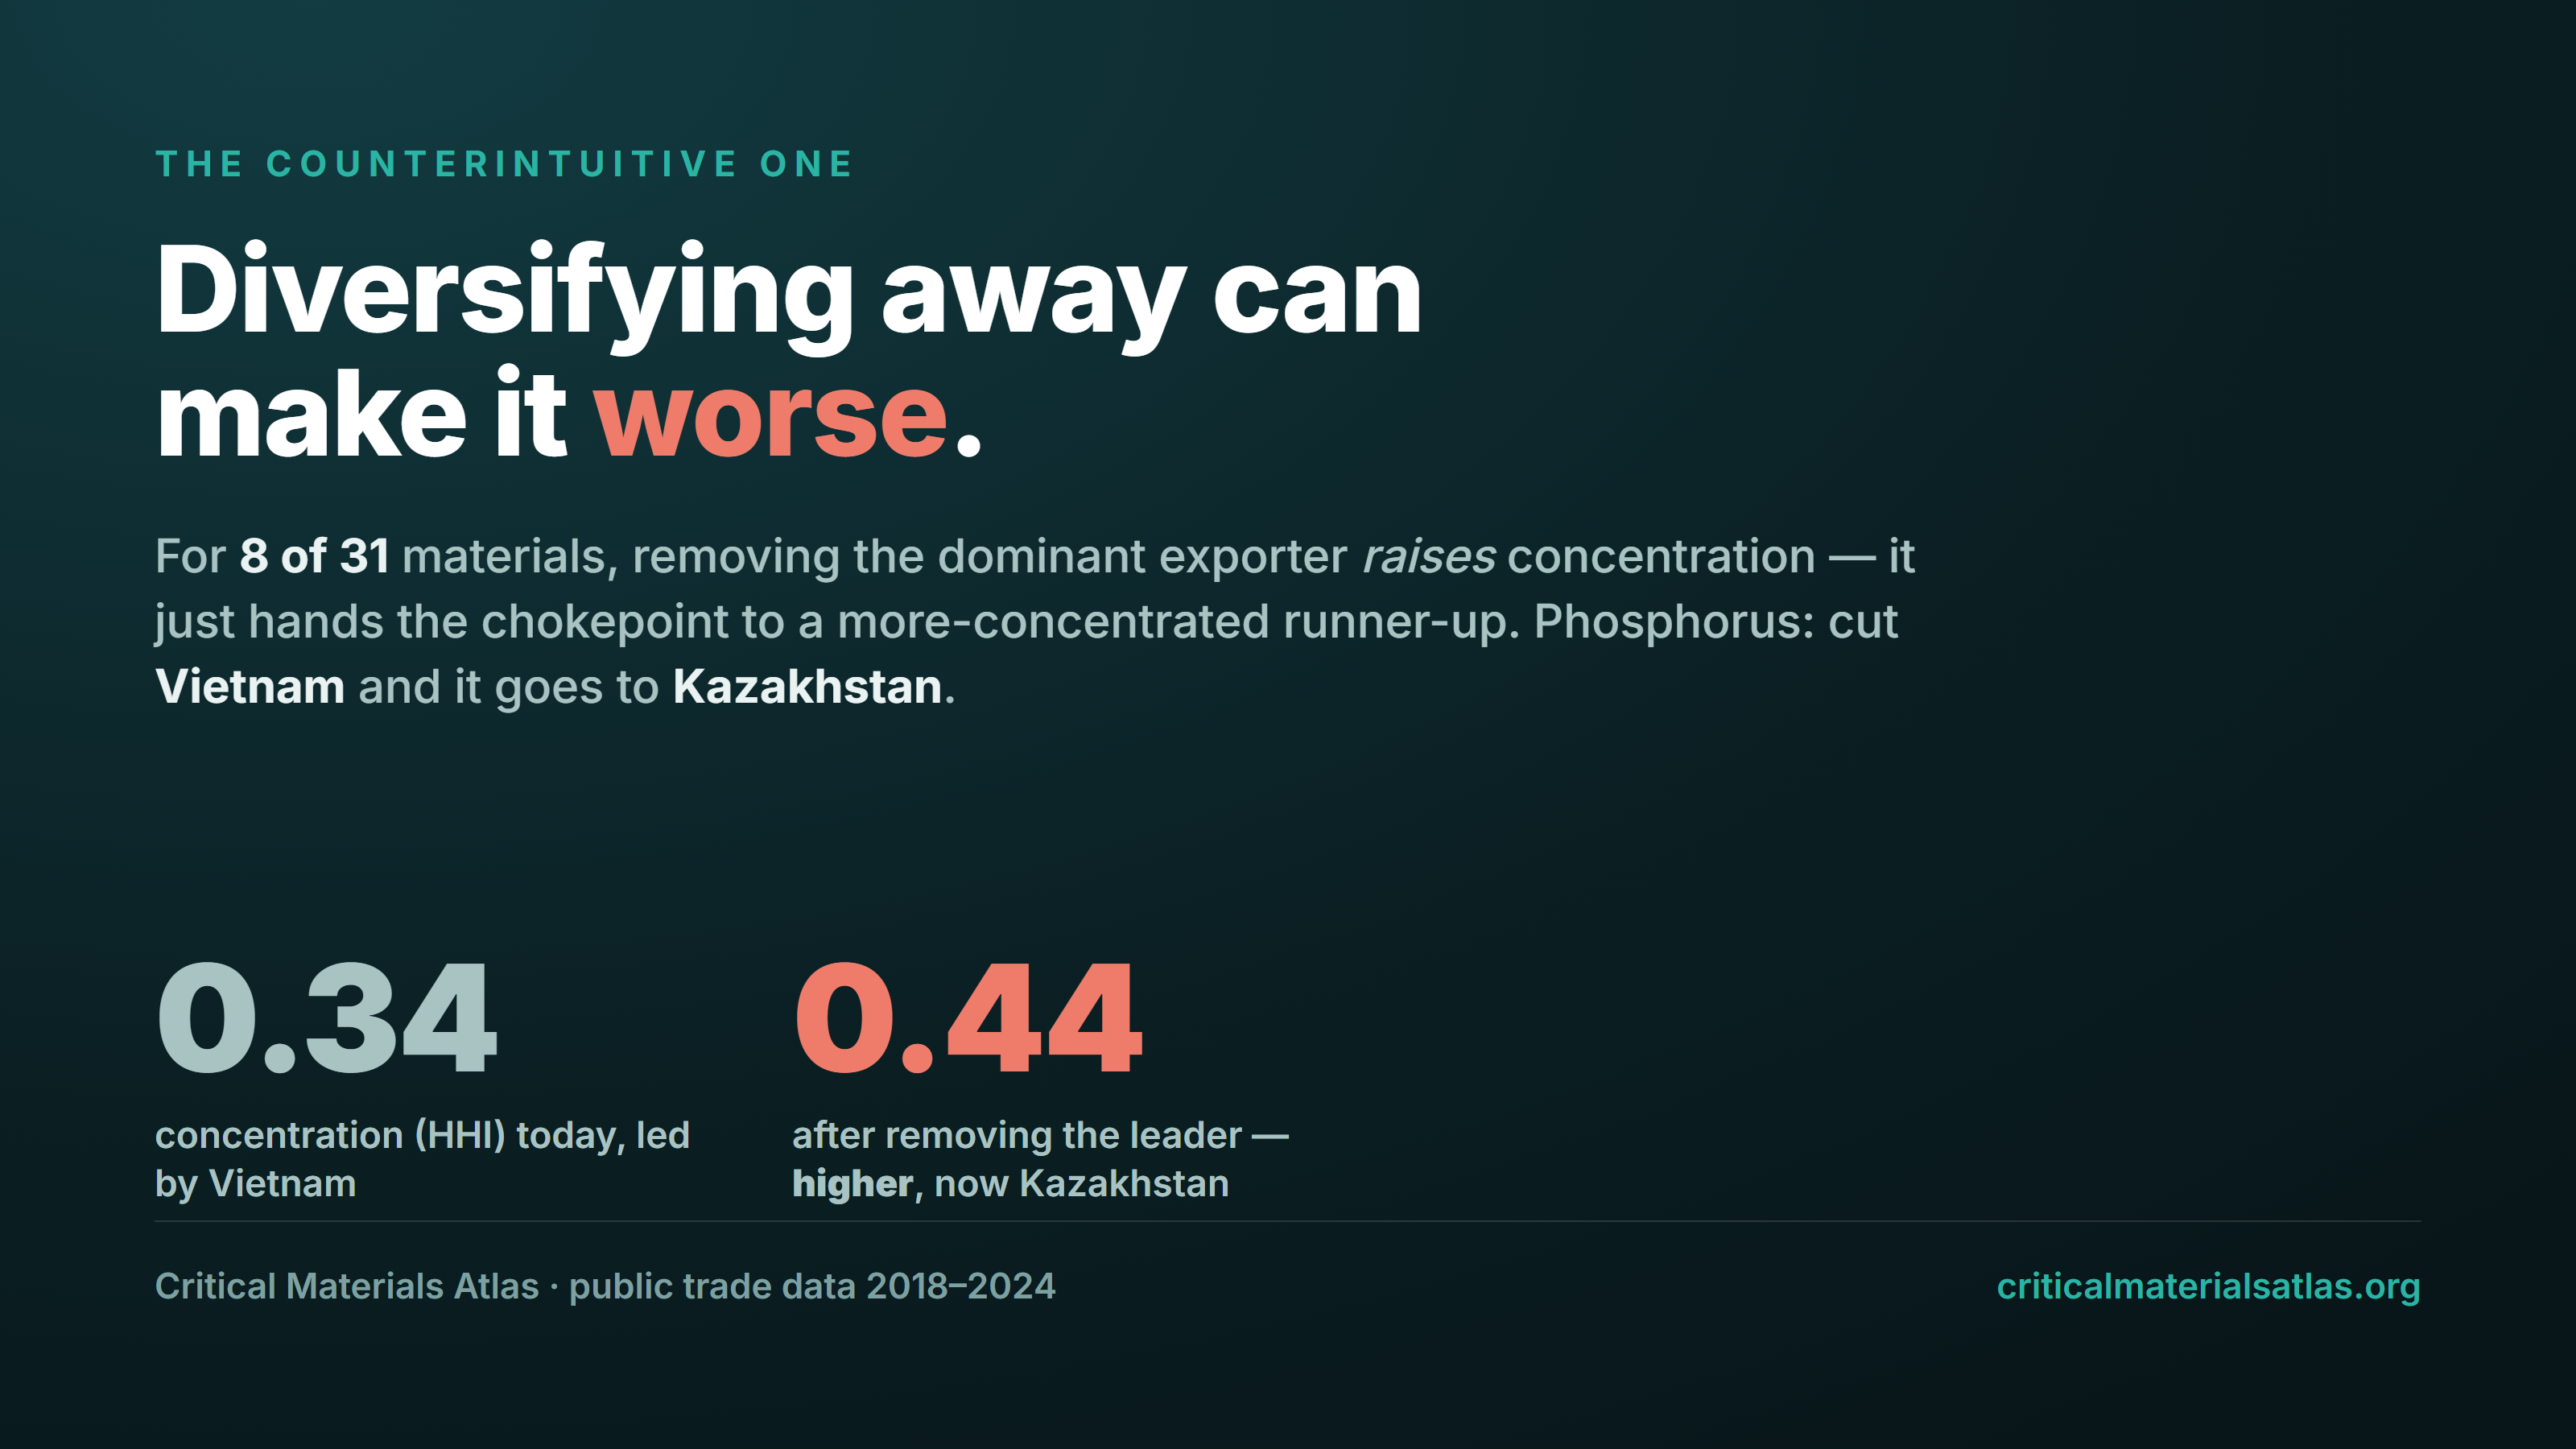
- Diversifying can backfire. Modelling a shock as the loss of the leader’s exports and reallocating optimally, 4 of 31 materials cannot be covered even if every other exporter doubles; and for 8 of 31, removing the leader hands the chokepoint to a more-concentrated runner-up (phosphorus → Kazakhstan, fluorspar → South Africa).
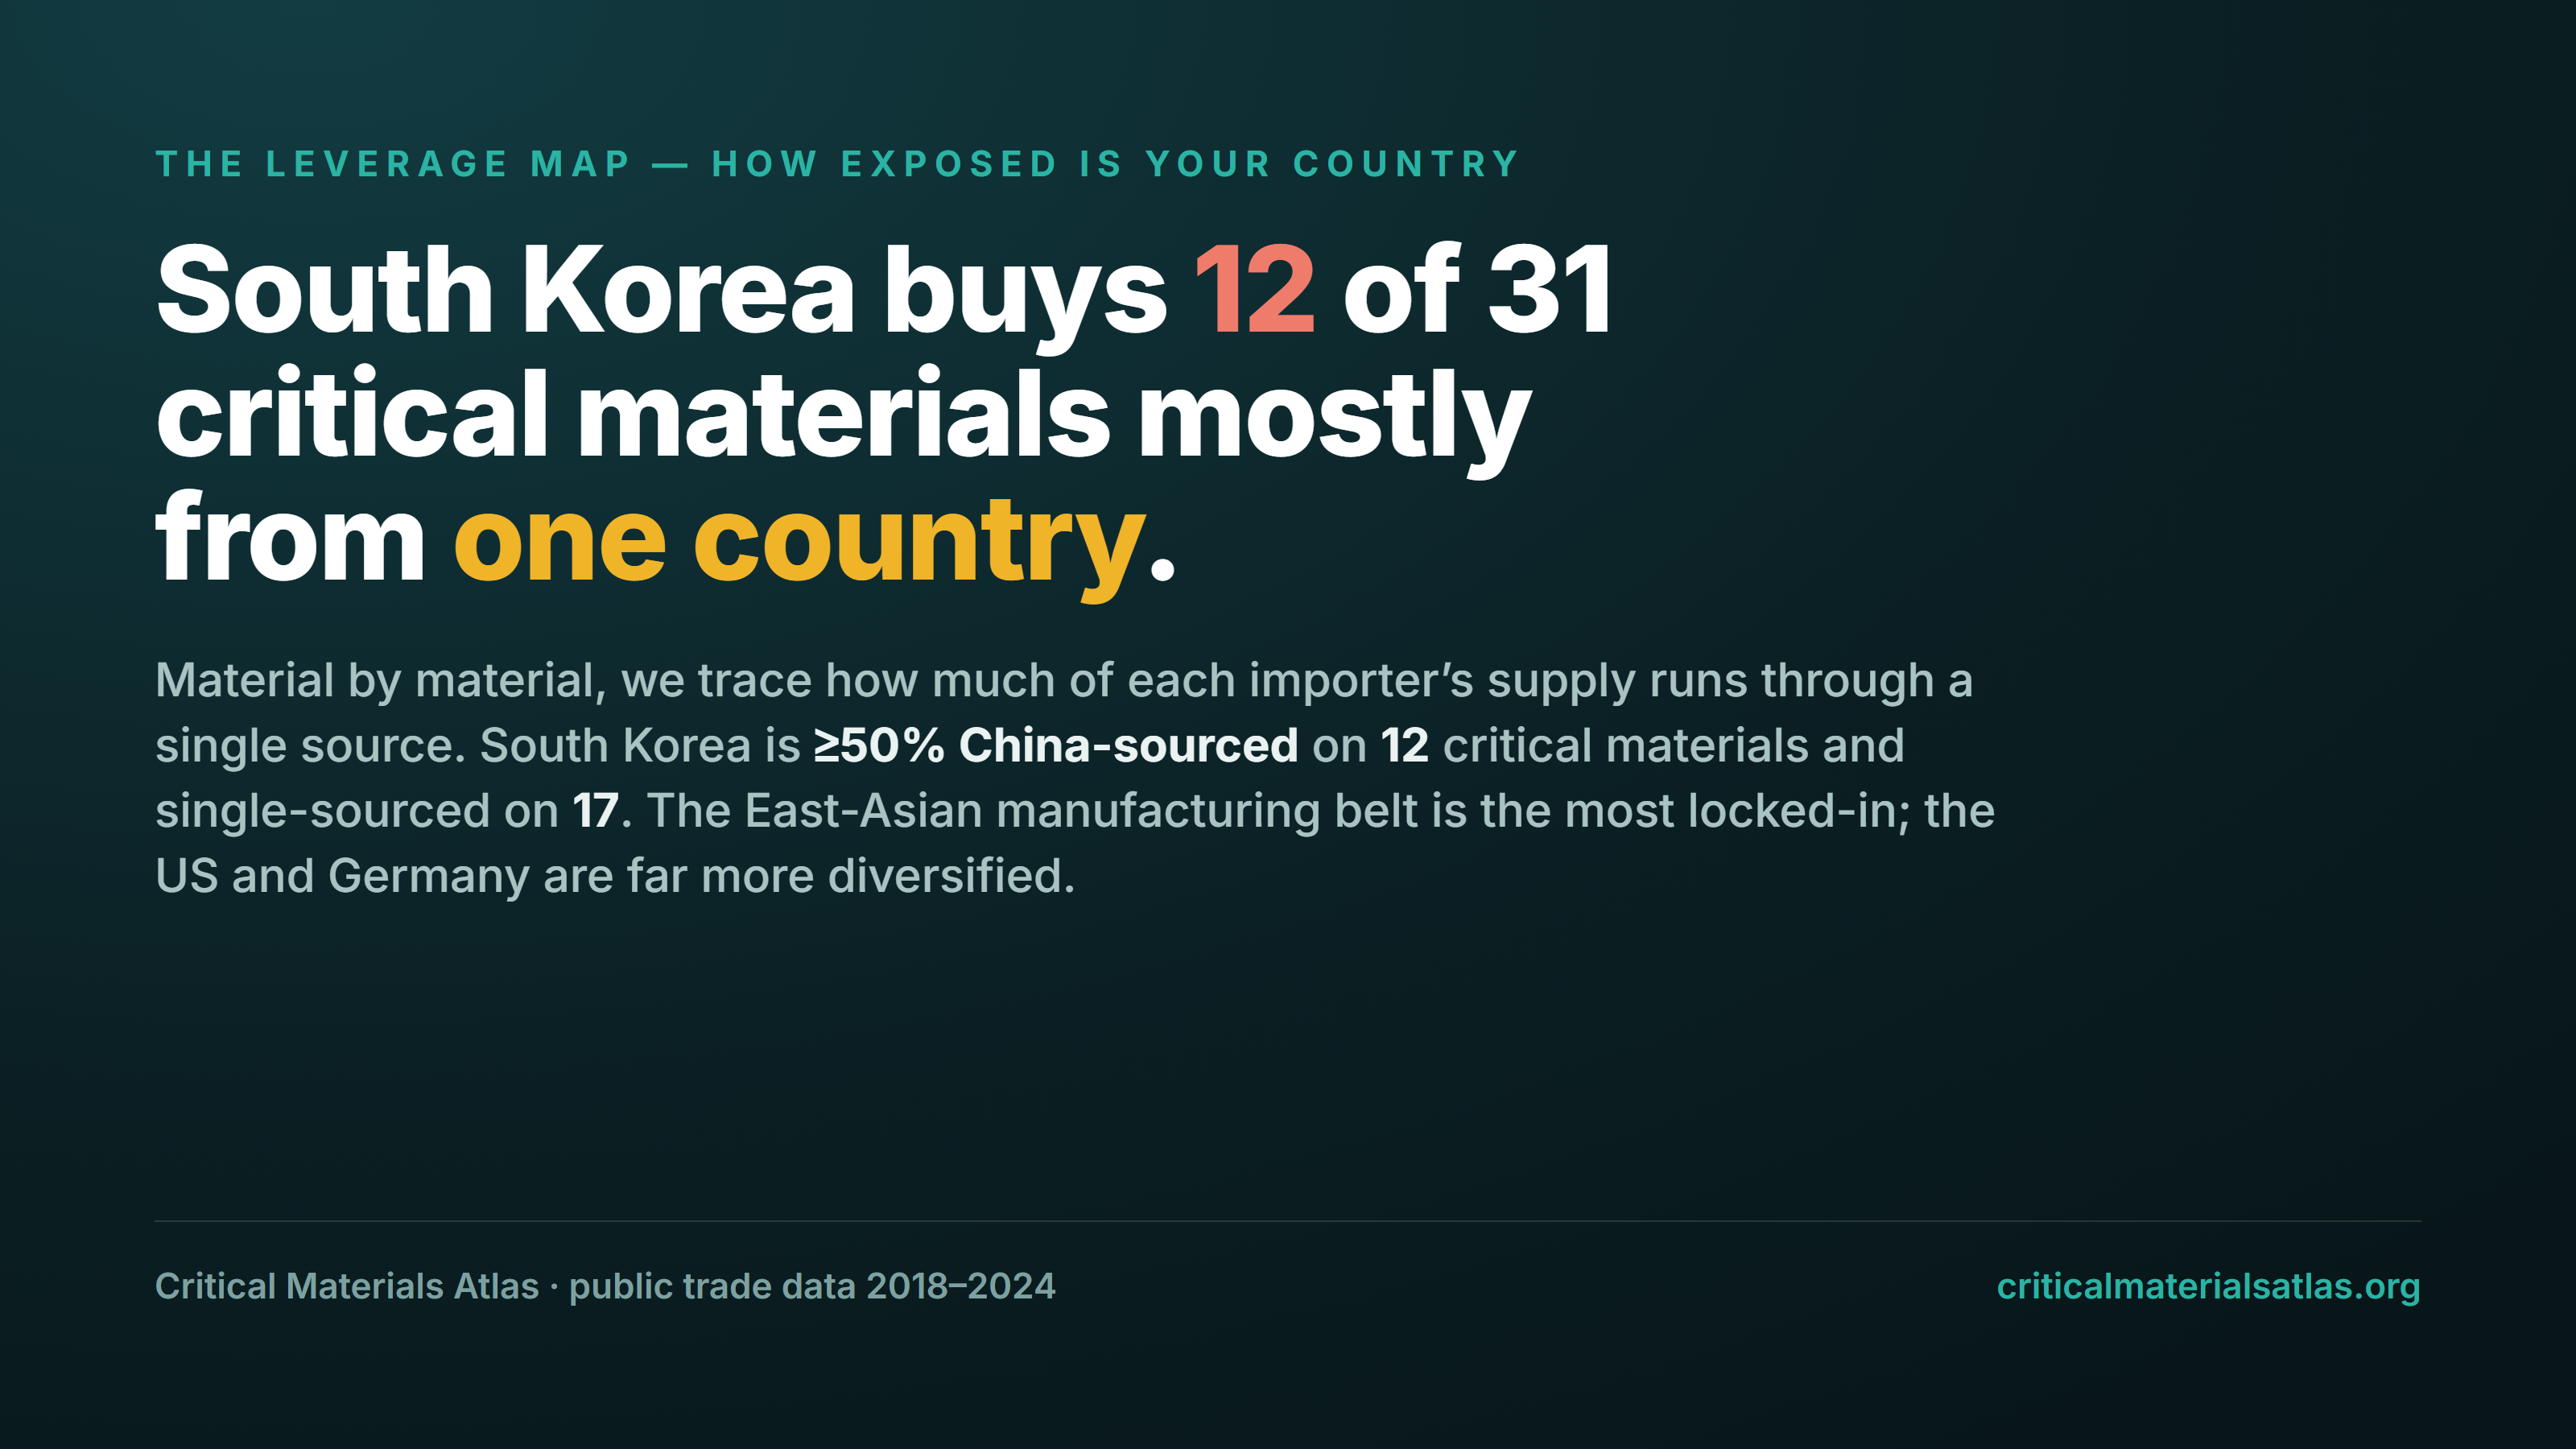
- Exposure is uneven and personal. The East-Asian manufacturing belt is the most locked-in — South Korea is ≥50%-China-sourced on 12 of 31 materials — while the US and Germany are far more diversified.
- Alternatives exist, but the buildout lags. For most chokepoints there are real, publicly-announced diversification projects (Perpetua, Almonty, Lynas, Euro Manganese…), but they are early-stage and thin relative to the concentration they would need to offset.
1 · What kind of moat
A chokepoint is not a chokepoint is not a chokepoint. If a leader imports the ore and exports the refined metal (Japan’s titanium sponge, Indonesia’s nickel, China’s tungsten), the moat is the furnace — tariffs or export controls on ore are useless; only new refining capability elsewhere breaks it. If the leader extracts the metal as a by-product of a domestic host it already controls (China’s gallium from its own alumina, germanium from zinc), there is no ore stream to redirect at all. Only where a leader genuinely mines and refines its own resource does ore access become a real lever. The same ~99% share can mean three completely different things to do.
2 · Can the rest of the world cover a cut?
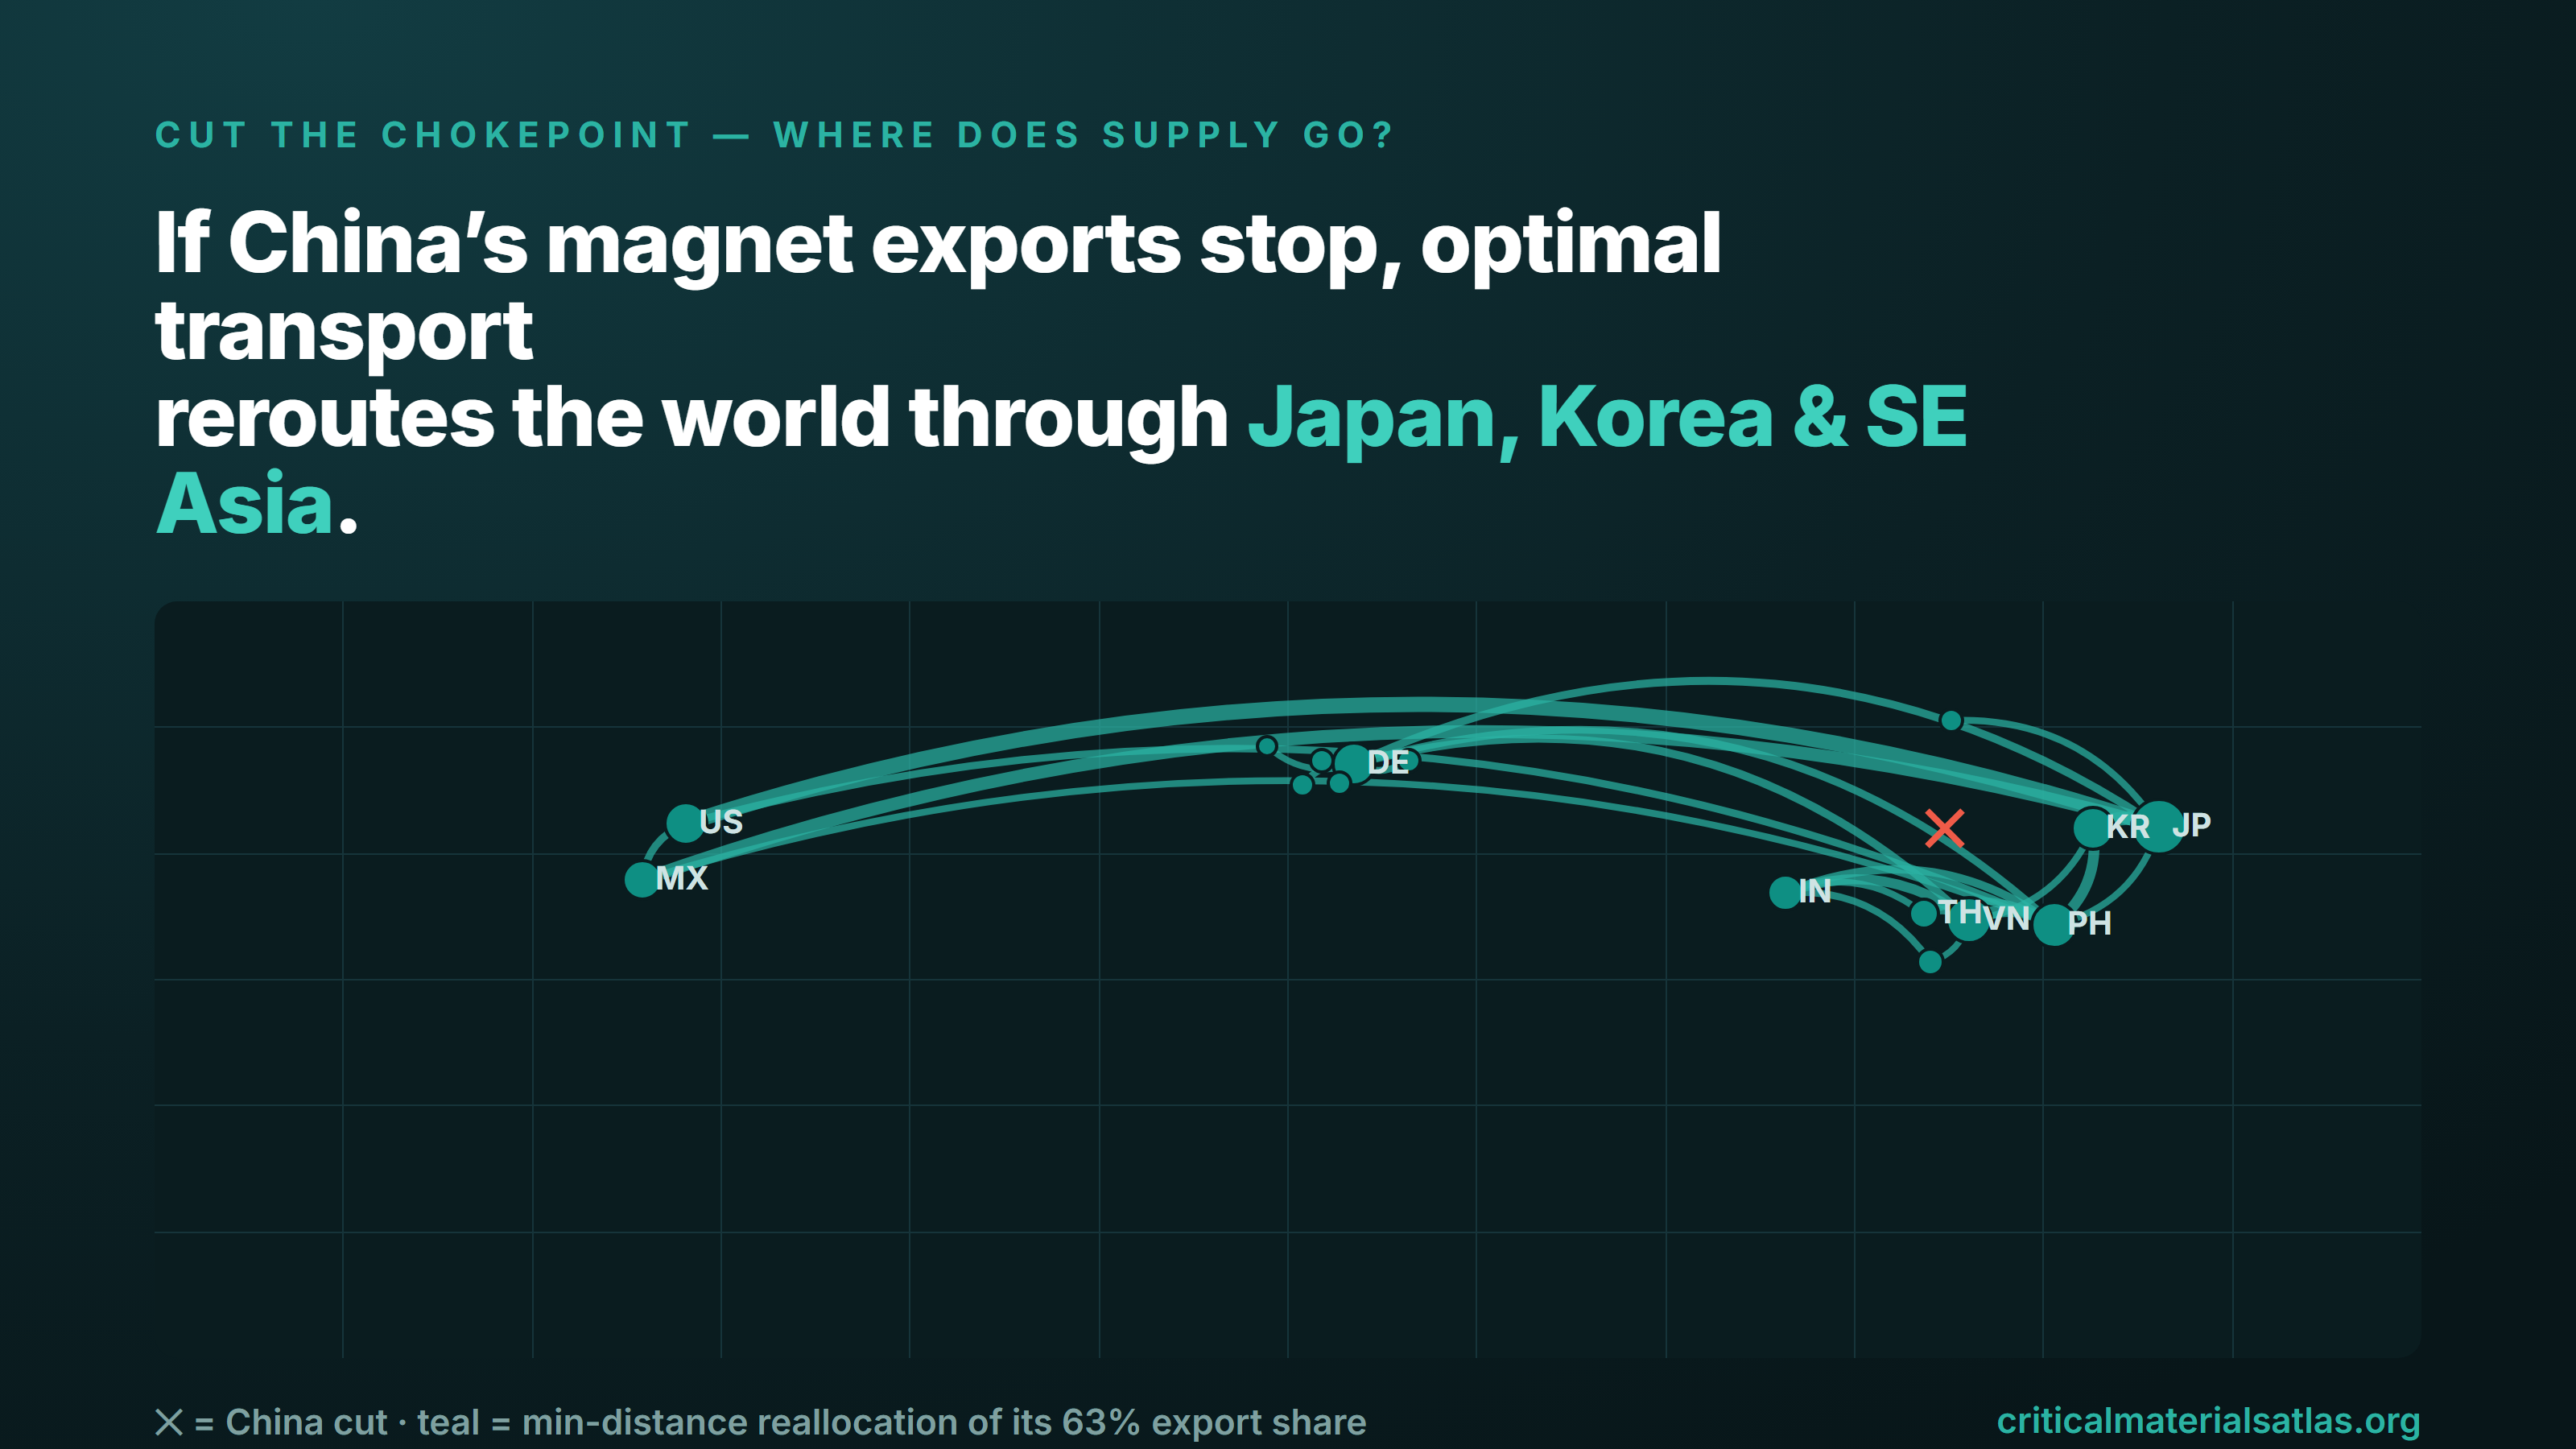
The usual question — “is there another exporter?” — is the wrong one, because a fallback exporter is already serving its own customers. We model a shock as the loss of the leader’s exports (the only supply that was ever redirectable) and reallocate its freed demand across every surviving exporter by optimal transport, on the real bilateral trade matrix. The results are sobering and, in places, counterintuitive.
3 · Who is exposed
The global finding becomes actionable only when it is made personal: for each importing country, how much of its supply runs through a single dominant source, material by material. The exposure is strikingly uneven — concentrated in the economies that manufacture the most.
4 · A note on what we do not claim
“Who could break it” is estimated from product-space capability-adjacency where a clean signal exists, and from current alternative-supplier shares otherwise — always labelled. We separately tested whether product-space proximity actually forecasts which countries develop downstream capability, and found that the apparent signal is largely a diversity artifact (already-diversified economies diversify further); that honest control is reported in the product-space work rather than overstated here. The reallocation is a statement about today’s capacity, not a forecast.
Method
Bilateral trade is reconciled from UN Comtrade via CEPII BACI (validated against the official series: top-1 exporter 25/30, 3.5% share error). Moat type is read from the trade feedstock signature (imports ore / exports refined) plus BGS/USGS physical output; refining concentration from refined-export HHI, cross-checked against the IEA Critical Minerals Dataset, EU CRM 2023, and the USGS World Minerals Outlook. The reallocation is an entropic optimal-transport (Sinkhorn) solve on the bilateral matrix; coverage assumes surviving exporters can scale to a stated ceiling. Full methods and all data are open. Figures are approximate and rounded; read each material as an overlay of distinct measures, not one observed pipeline.
@techreport{cma_report01_2026,
  title       = {Breaking the chokepoint: from finding to decision},
  author      = {{Critical Materials Atlas}},
  institution = {Critical Materials Atlas},
  number      = {Report 01},
  year        = {2026},
  publisher   = {Zenodo},
  doi         = {10.5281/zenodo.21948855},
  url         = {https://criticalmaterialsatlas.org/report-decision-layer.html}
}